

The Data Viewer page features the UMAP that presents the sample characteristics and gene expressions in the Developmental Lung Cell Atlas. From the “Data Viewer” tab, you can choose to view a particular UMAP of lung.
(1) : You can choose different atlas to display the UMAPs.
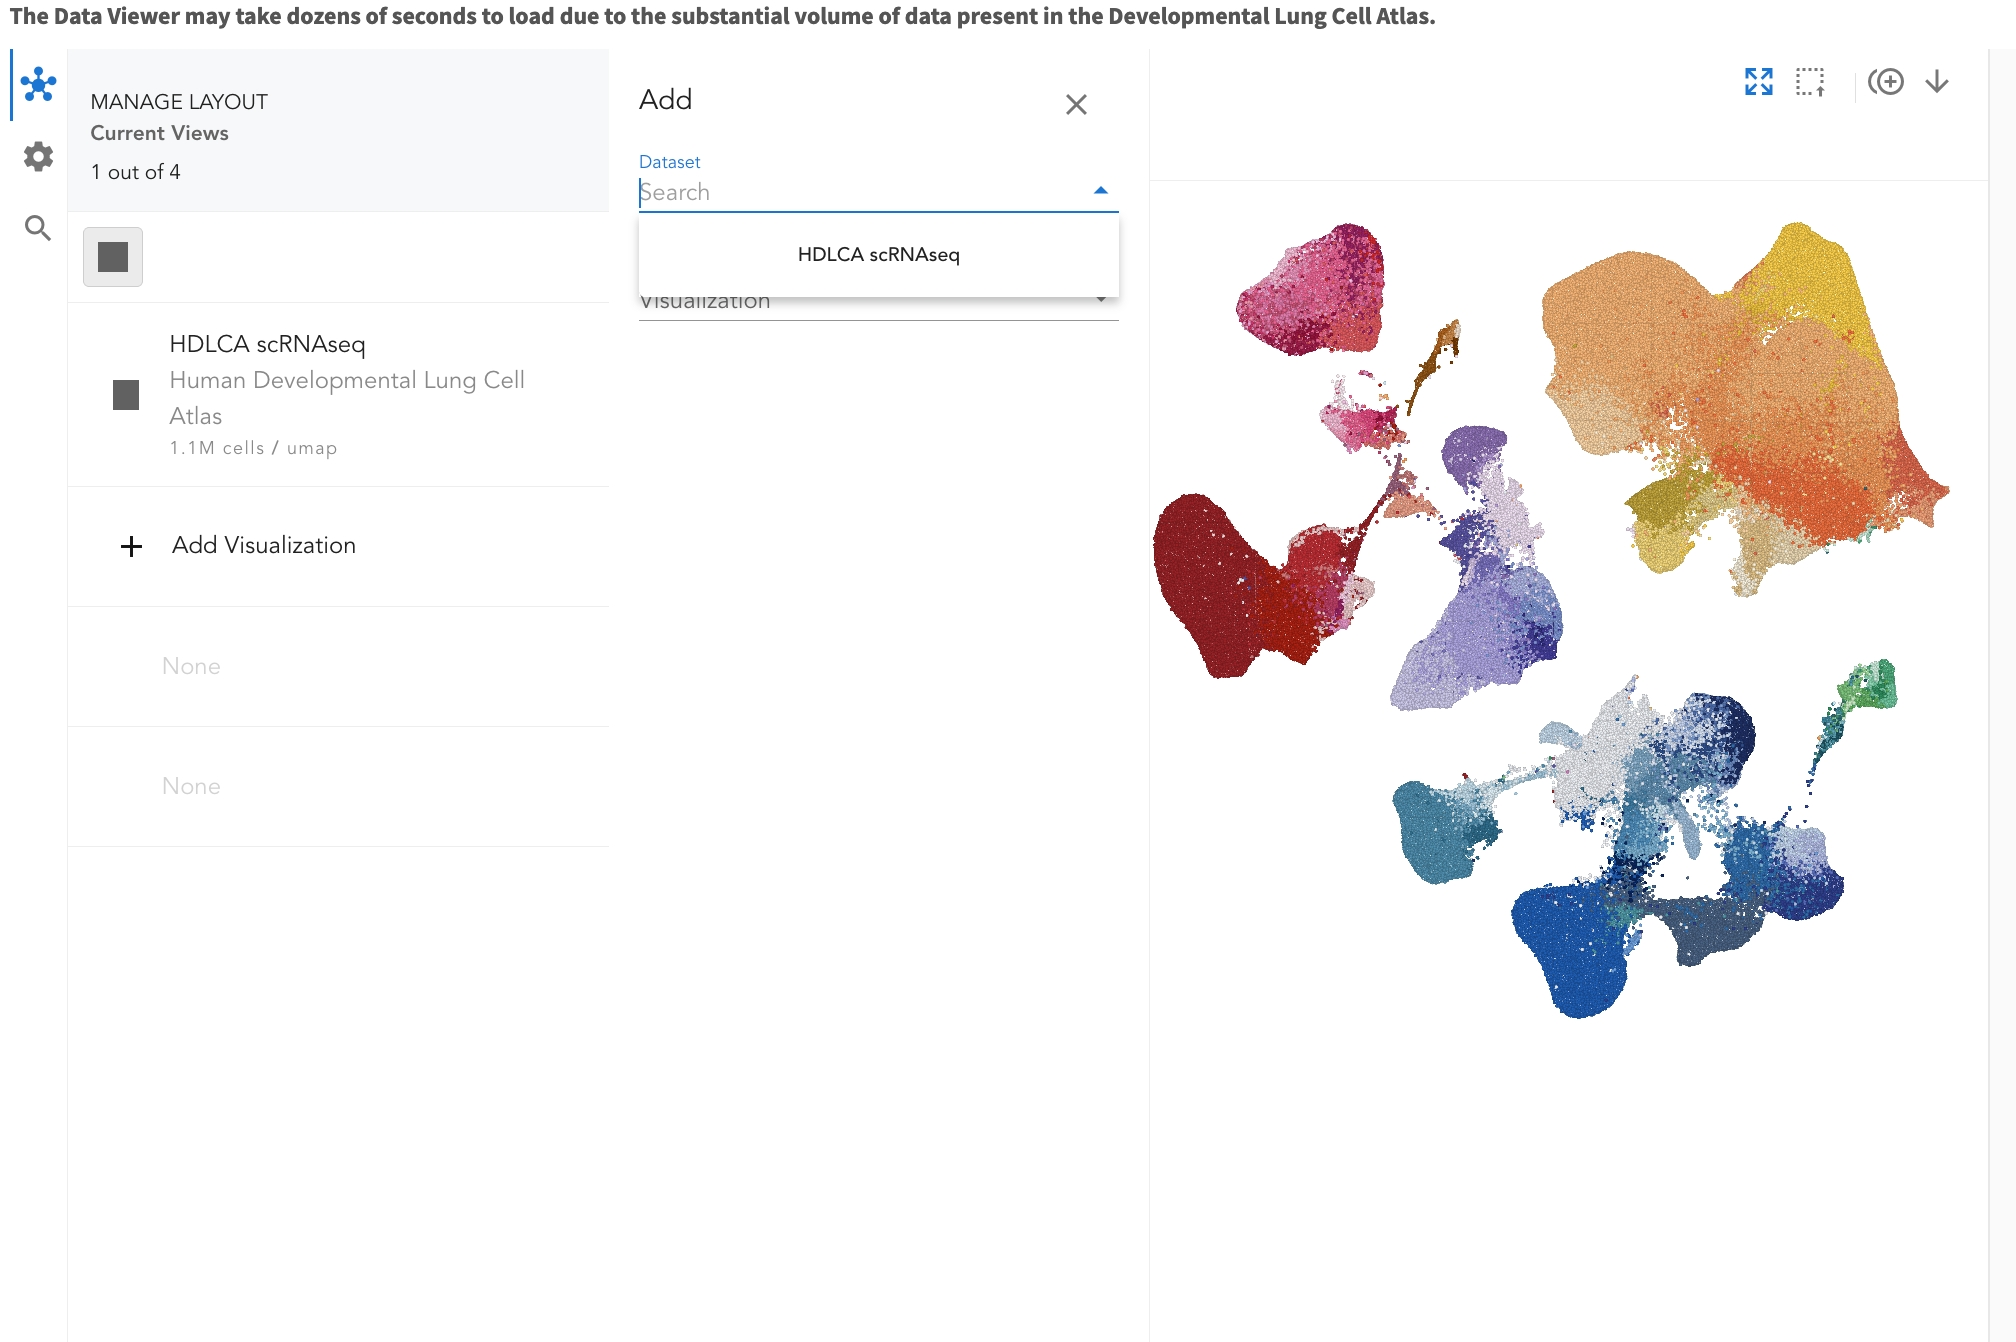
(2) : You can view coloured cells from a certain attribute for the cells. Several other dimiensions to view the UMAP are described in the first table of the Help Page
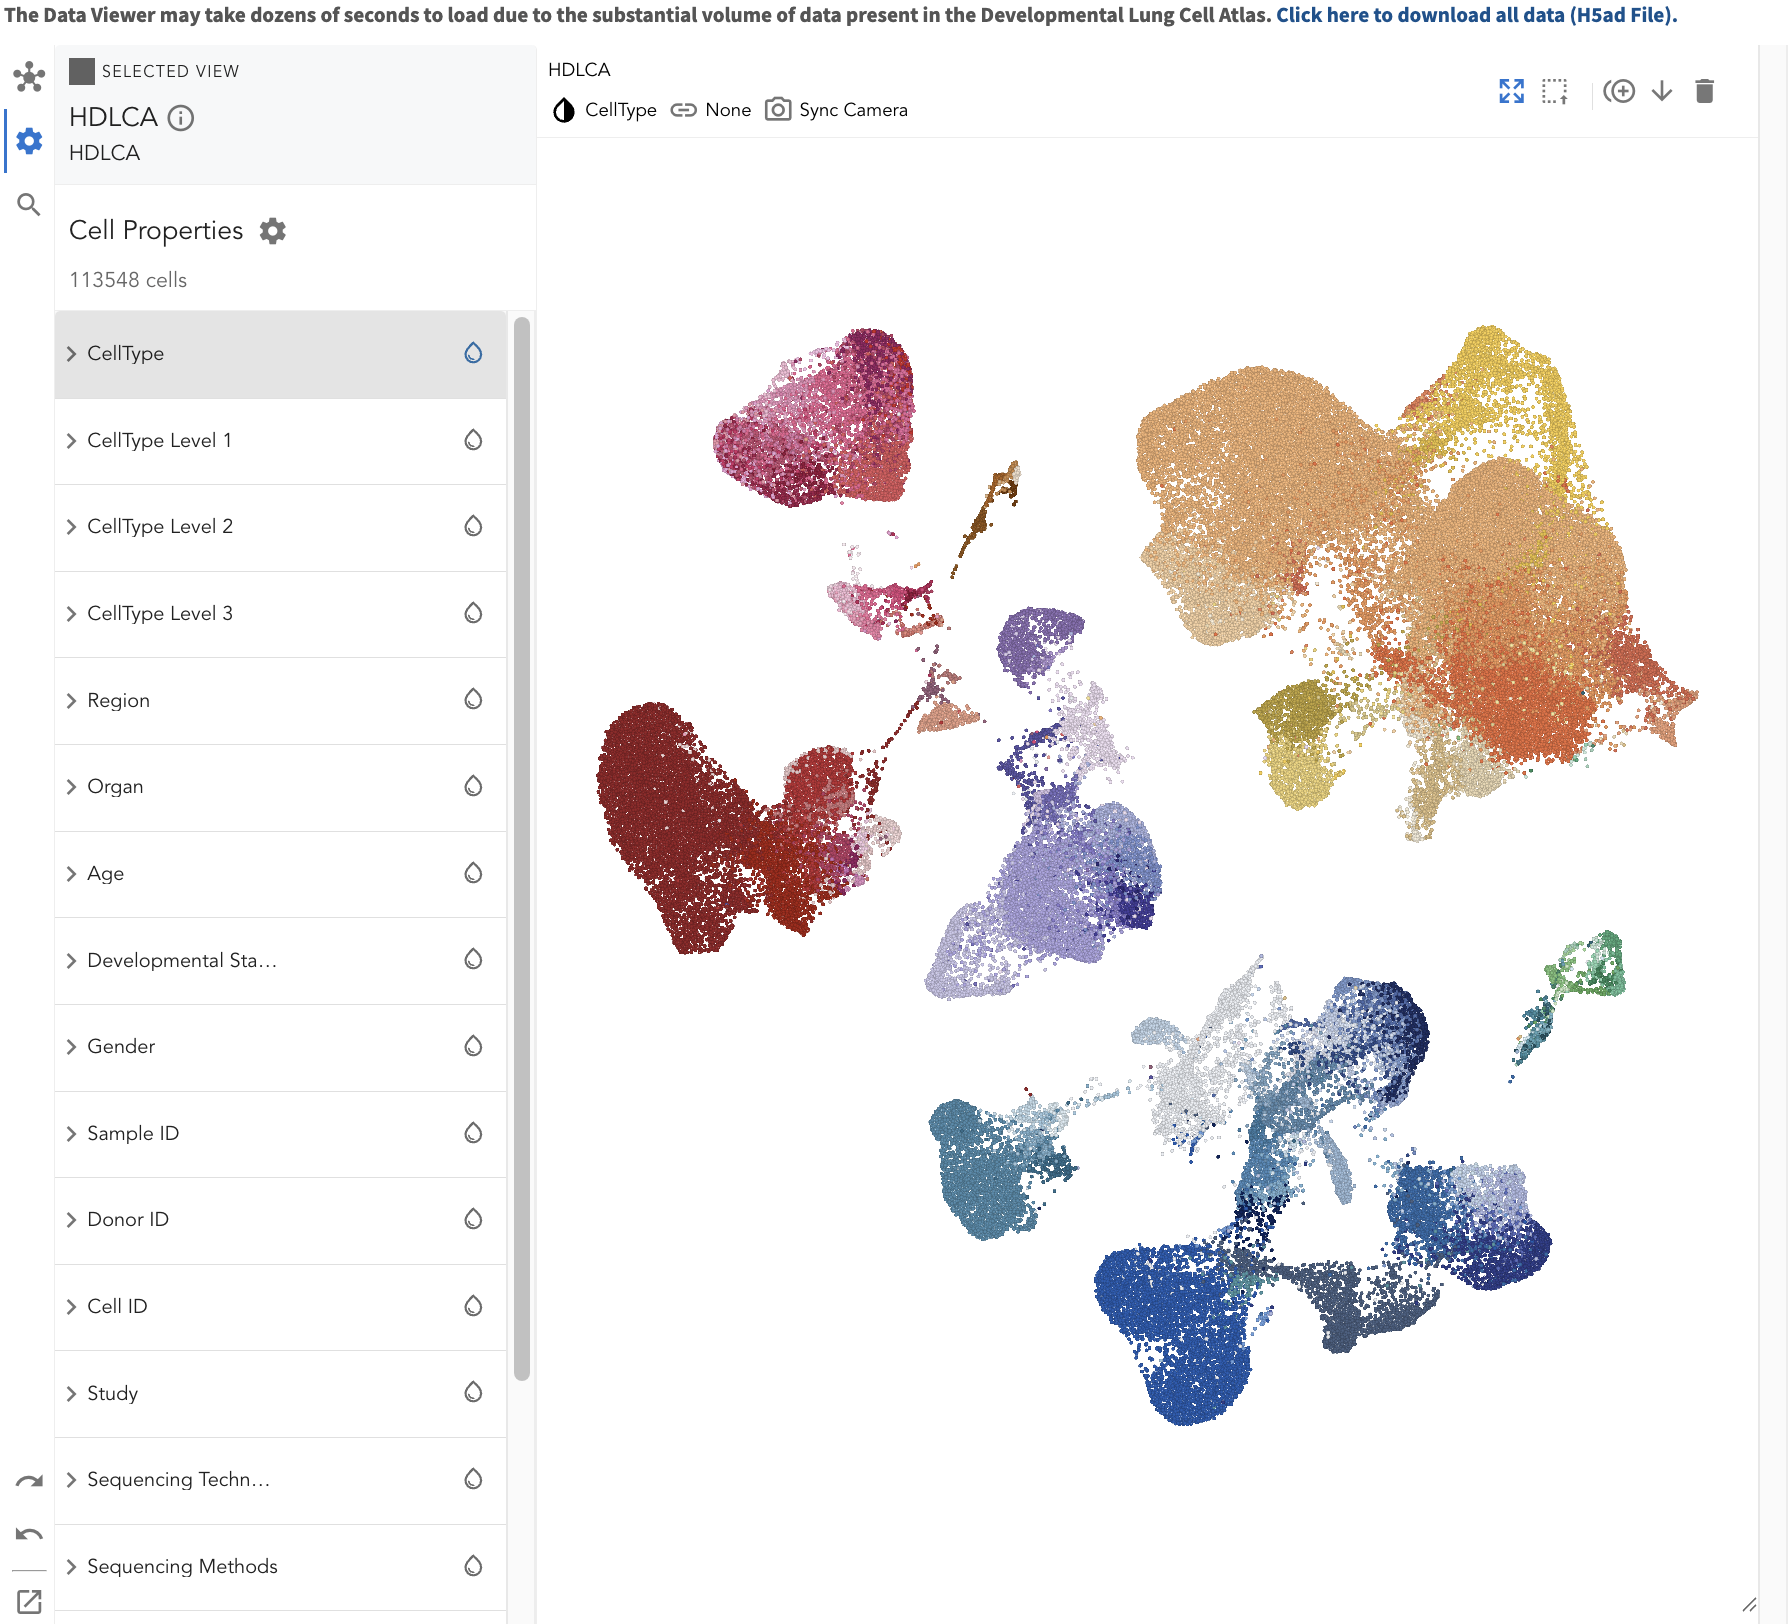
A list of selectable attributes to display the UMAPs are shown in the left column.
| Name | Description |
|---|---|
| CellType | Cell type annotation. |
| CellType Level1 | Broad cell type class. |
| CellType Level2 | Fine cell type. |
| CellType Level3 | Cell subtype. |
| Anatomical Region | Anatomical structure(Please find details in the third table of the Help Page). |
| Age | For postnatal individuals, 6 months old is denoted by 6mo; 21 years old is denoted by "21 yr". For prenatal individuals, 9 PCW stands for post-conception weeks. |
| Developmental Stage | Developmental stage of each individual. |
| Gender | F = Female; M = Male; Unclassified = Unknown. |
| Sample ID | Sample ID of the cells or nuclei. |
| Donor ID | Author specified donor IDs, which are indicated in the original publications. |
| Study | Publications in the HDLCA reference atlas. |
| Sequencing Technology | Sequencing technology of the cells or nuclei. |
| Sequencing Methods | Sequencing method of the cells or nuclei. |
| Sample Type | Categorizes samples according to the developmental stage of the donor, including fetal, infancy, adolescence and adult. |
| Sample Status | Health status of the tissue source. |
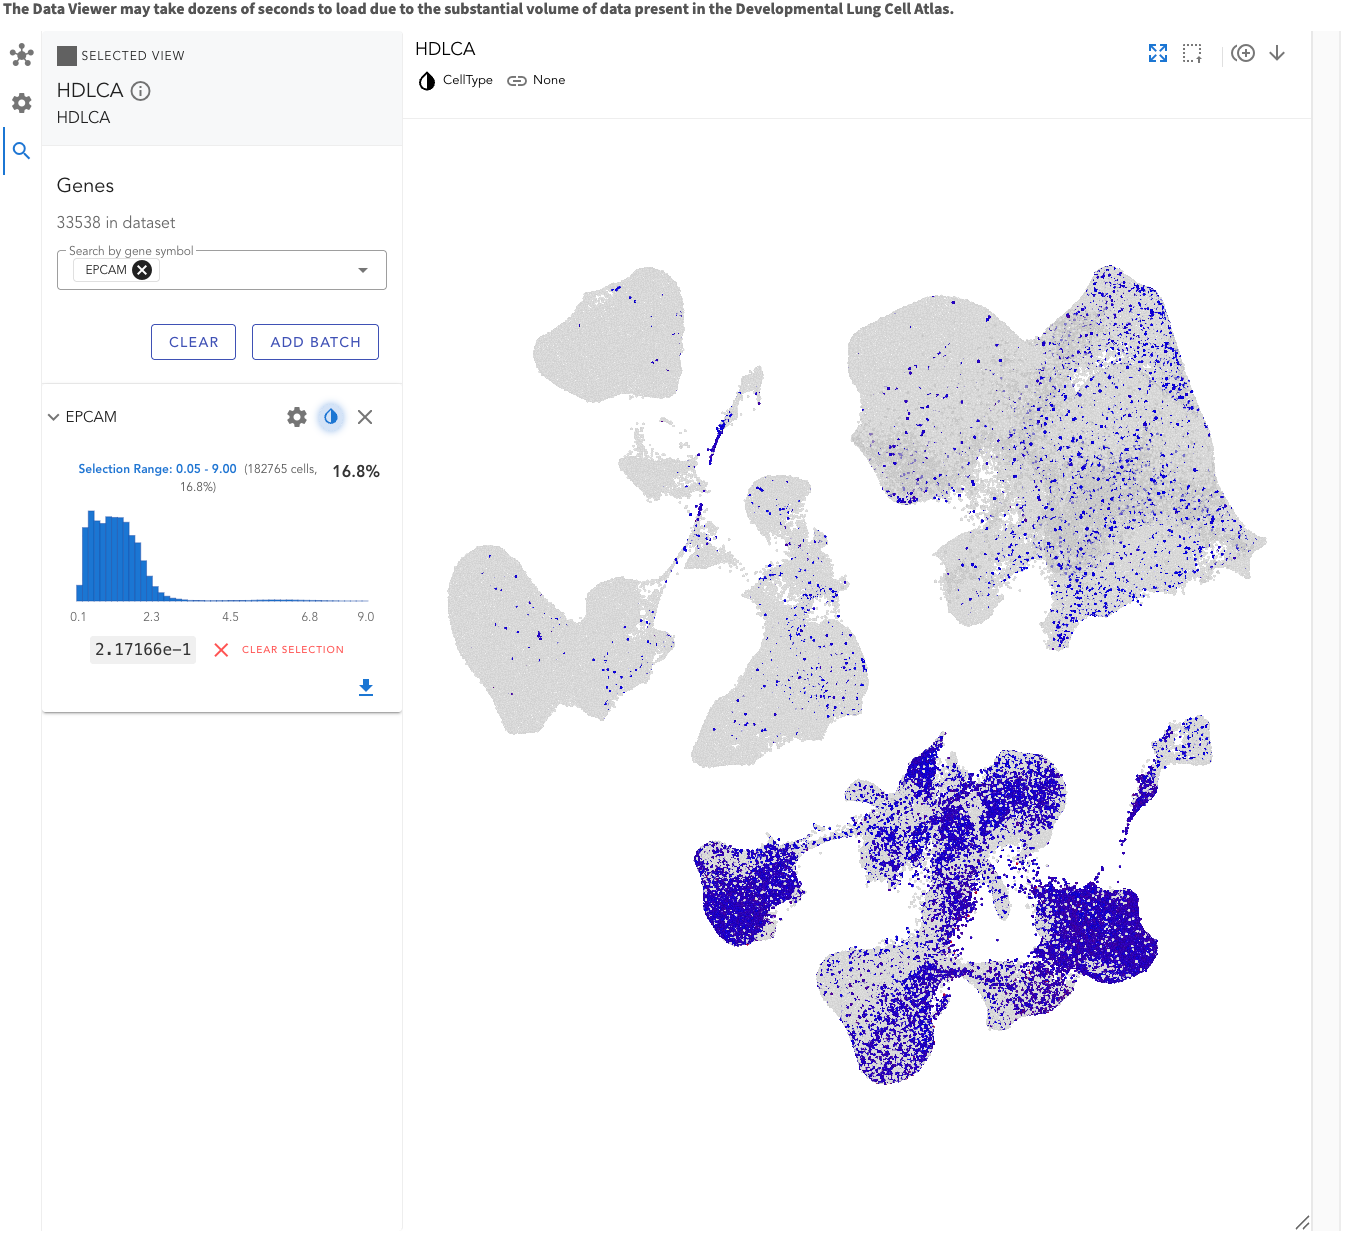
(3) : You can view coloured cells according to the expression level of the selected gene.
(4) The symbol attributes of the page.
| Symbol | Description |
|---|---|
| Choose different atlas to display the UMAPs. | |
| View coloured cells according to the selected attribute in Cell Metadata. | |
| View coloured cells according to the expression level of the selected gene. | |
| Indicate the Cell Metadata attribute currently selected to colour cells in the UMAP. | |
| Indicate the number of selected subcategories used to color cells within the selected Cell Metadata attribute. | |
| Reset the complete UMAP graph after cropped screenshot. | |
| Capture a region of the UMAP for a cropped screenshot. | |
| Multi-page display of the UMAP. | |
| Download the UMAP graph. |
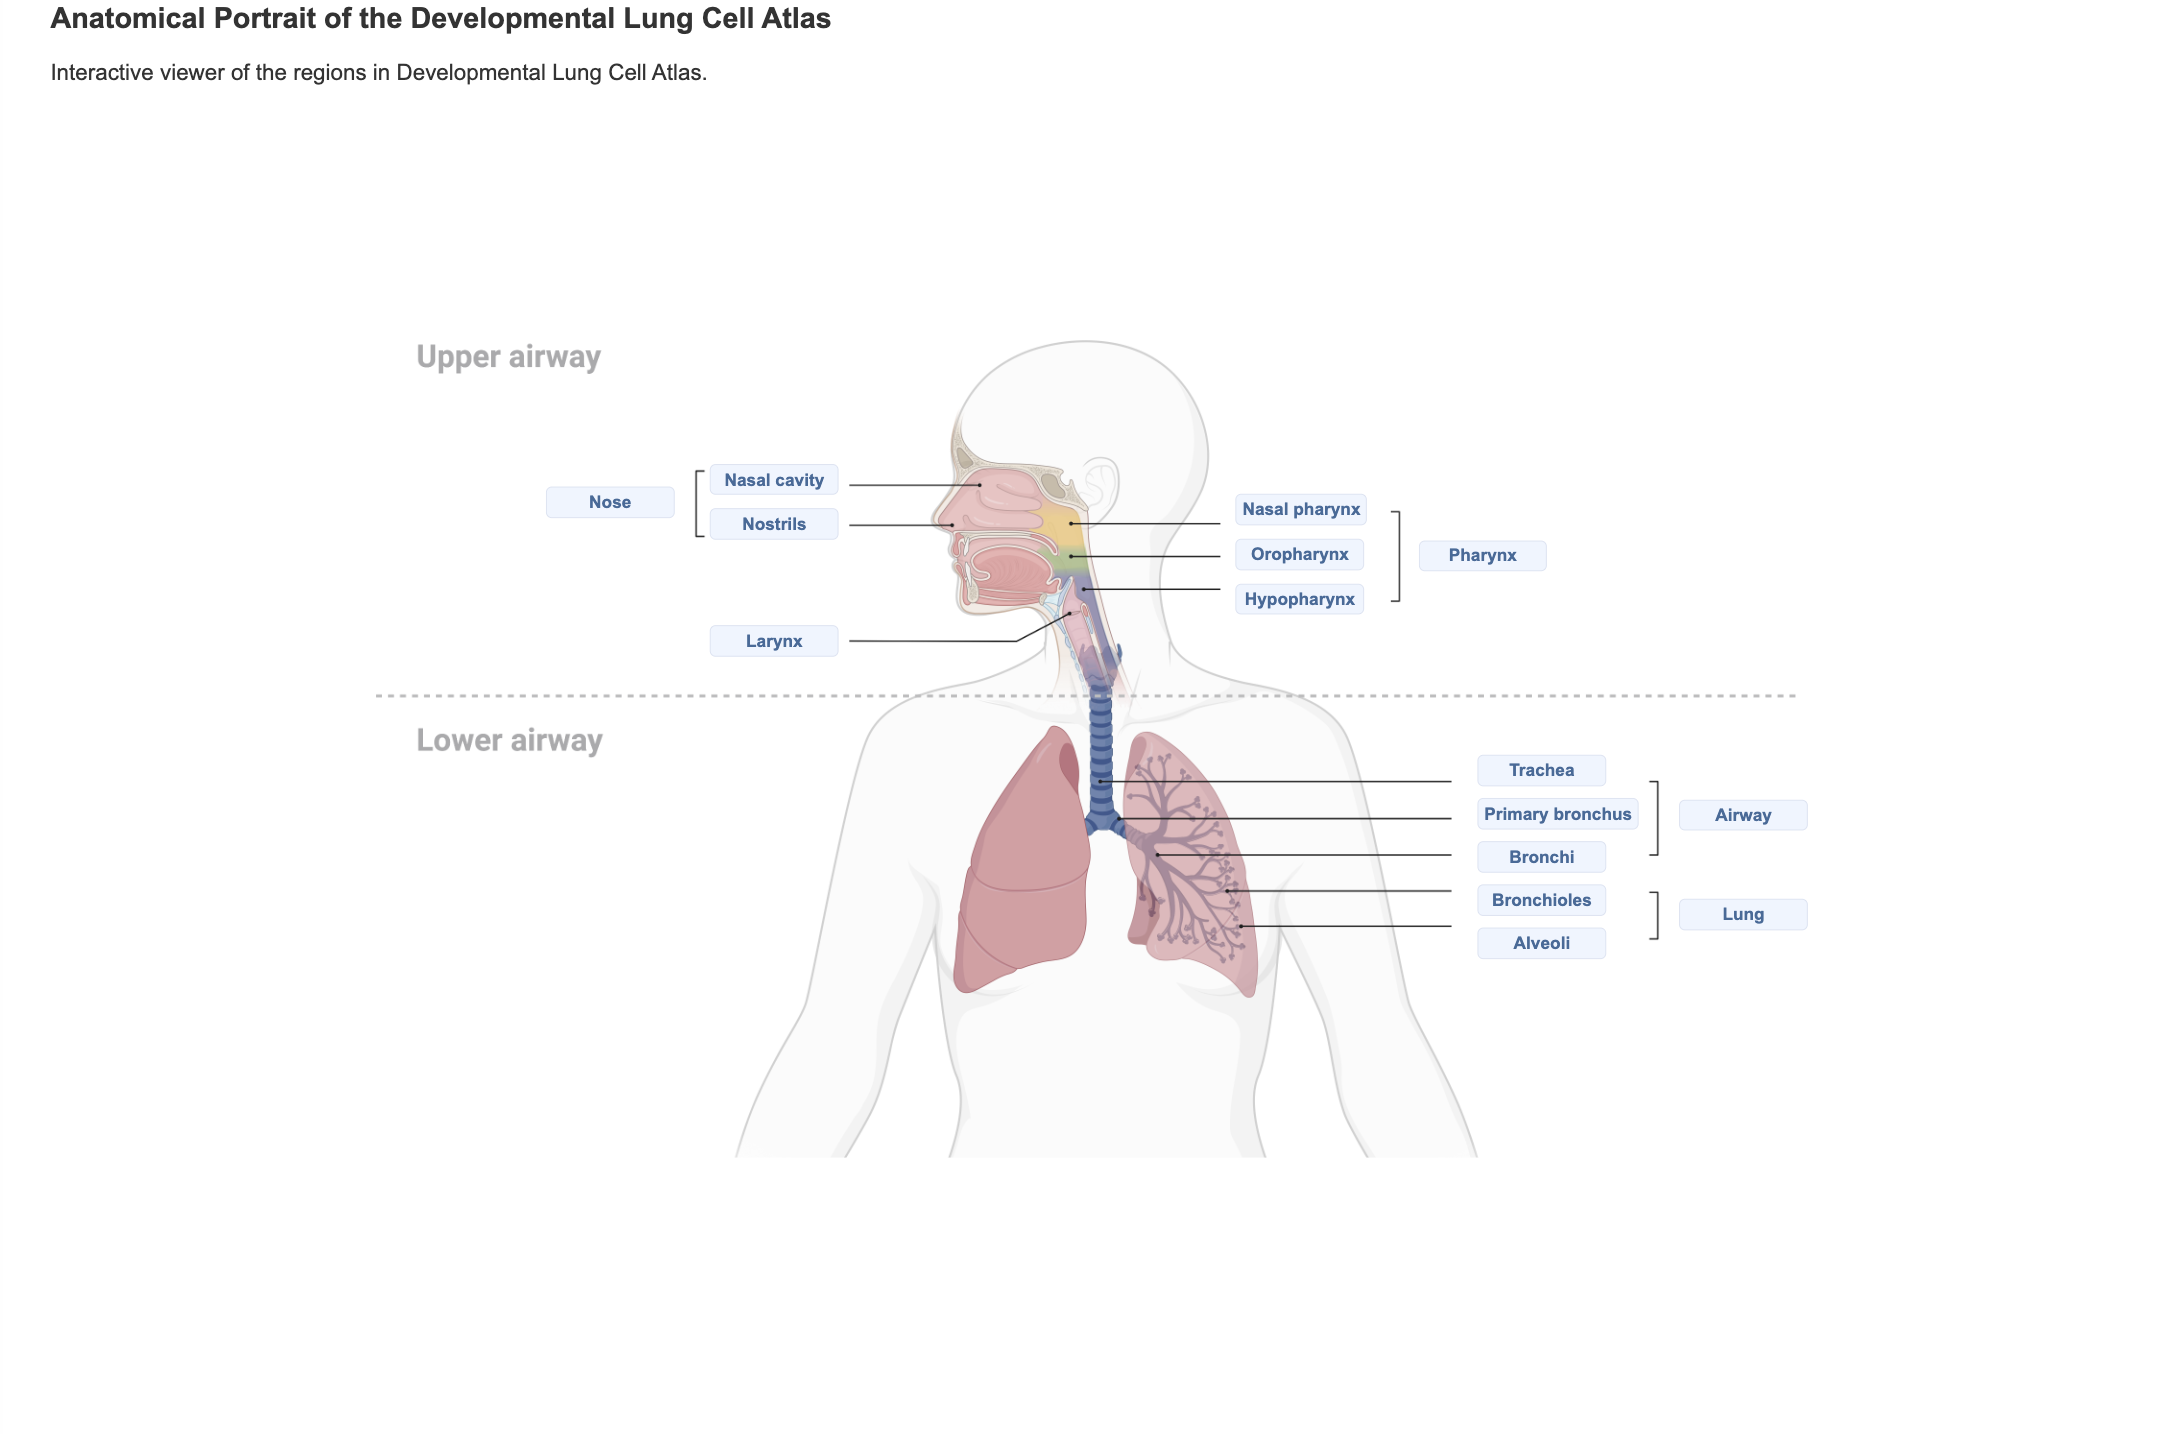
The interactive viewer shows the human lung and includes all the major regions from the data used in Developmental Lung Cell Atlas. You can click on the relevant label and the page will direct to the data viewer page to display information about that area.
| Original Region | Broad Region | Region |
|---|---|---|
| Lung | Lung | Lung |
| Right lobes | Lung lobe | Right lobes |
| Peripheral lung | Periphery | Periphery |
| Whole lung | Whole lung | Whole lung |
| d_LowLeftPar | Parenchyma | Parenchyma |
| a_Trachea | Trachea | Trachea |
| Distal lung | Distal lung | Distal lung |
| e_TopLeftPar | Parenchyma | Parenchyma |
| Right middle lobe | Right middle lobe | Right middle lobe |
| Distal airway | Distal airway | Distal airway |
| Proximal airway epithelium | Proximal airway | Proximal airway |
| c_Bronchi.4 | Bronchi | Bronchi |
| Proximal lung | Proximal lung | Proximal lung |
| Middle airway | Middle airway | Middle airway |
| b_Bronchi.2.3 | Bronchi | Bronchi |
| Right upper lobe periphery region | Periphery | Periphery |
| Left lower lobe periphery region | Periphery | Periphery |
| Trachea | Trachea | Trachea |
| Right upper lobe mid-bronchial region | Bronchi | Bronchi |
| Left lower lobe bronchus region | Bronchi | Bronchi |
| Left upper lobe periphery | Periphery | Periphery |
| Right lobes | Right lobes | Right lobes |
| Bronchus | Bronchi | Bronchi |
| Bronchiole | Bronchiole | Bronchioles |
The table shows the information of regions. The Concrete Region is the original annotation of studies; the Broad Region is rough region; the Anatomical Region is the anatomical division of the region.
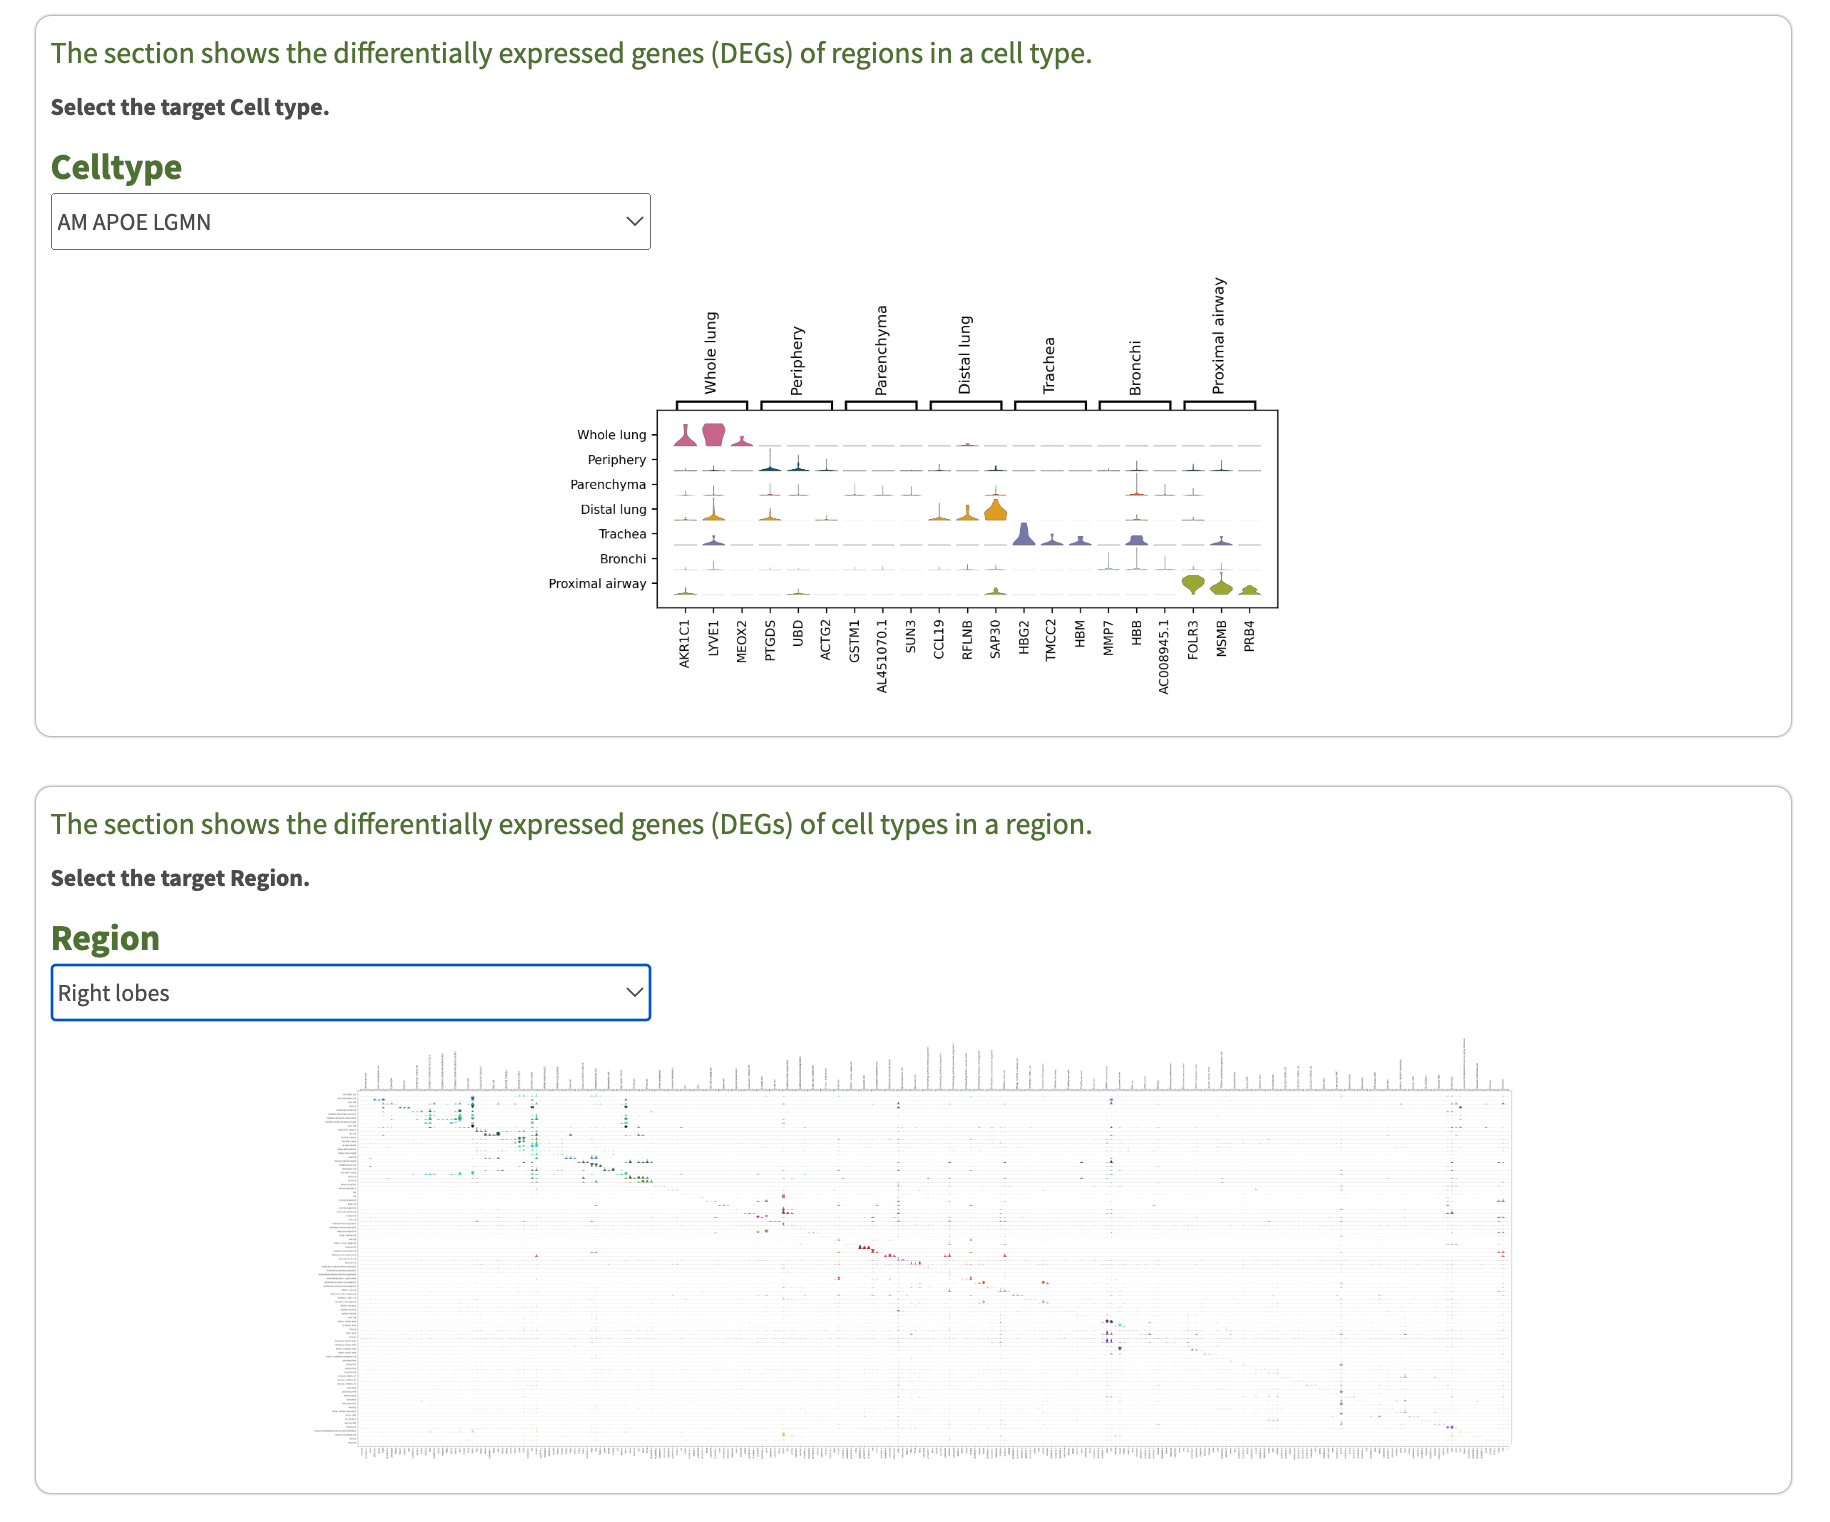
Users can obtain a list of differentially expressed genes of the cell types from a selected lung region,or of different lung regions from a selected cell type.
To calculate candidate markers within a specific region by selecting tabs By Region or find candidate markers of a cell type by selecting the tab By Cell Type. After selection and click on the tab Markers, a volcano plot will be shown.
For example, if you click By Region, the search box will show the region and cell type, you can select a region and a cell type, this function is to show the differential genes of your selected cell type and other cell types under the same region, and clicking the Markers button will show the volcano map and the csv table of the differential genes. Clicking the All button
means selecting all regions.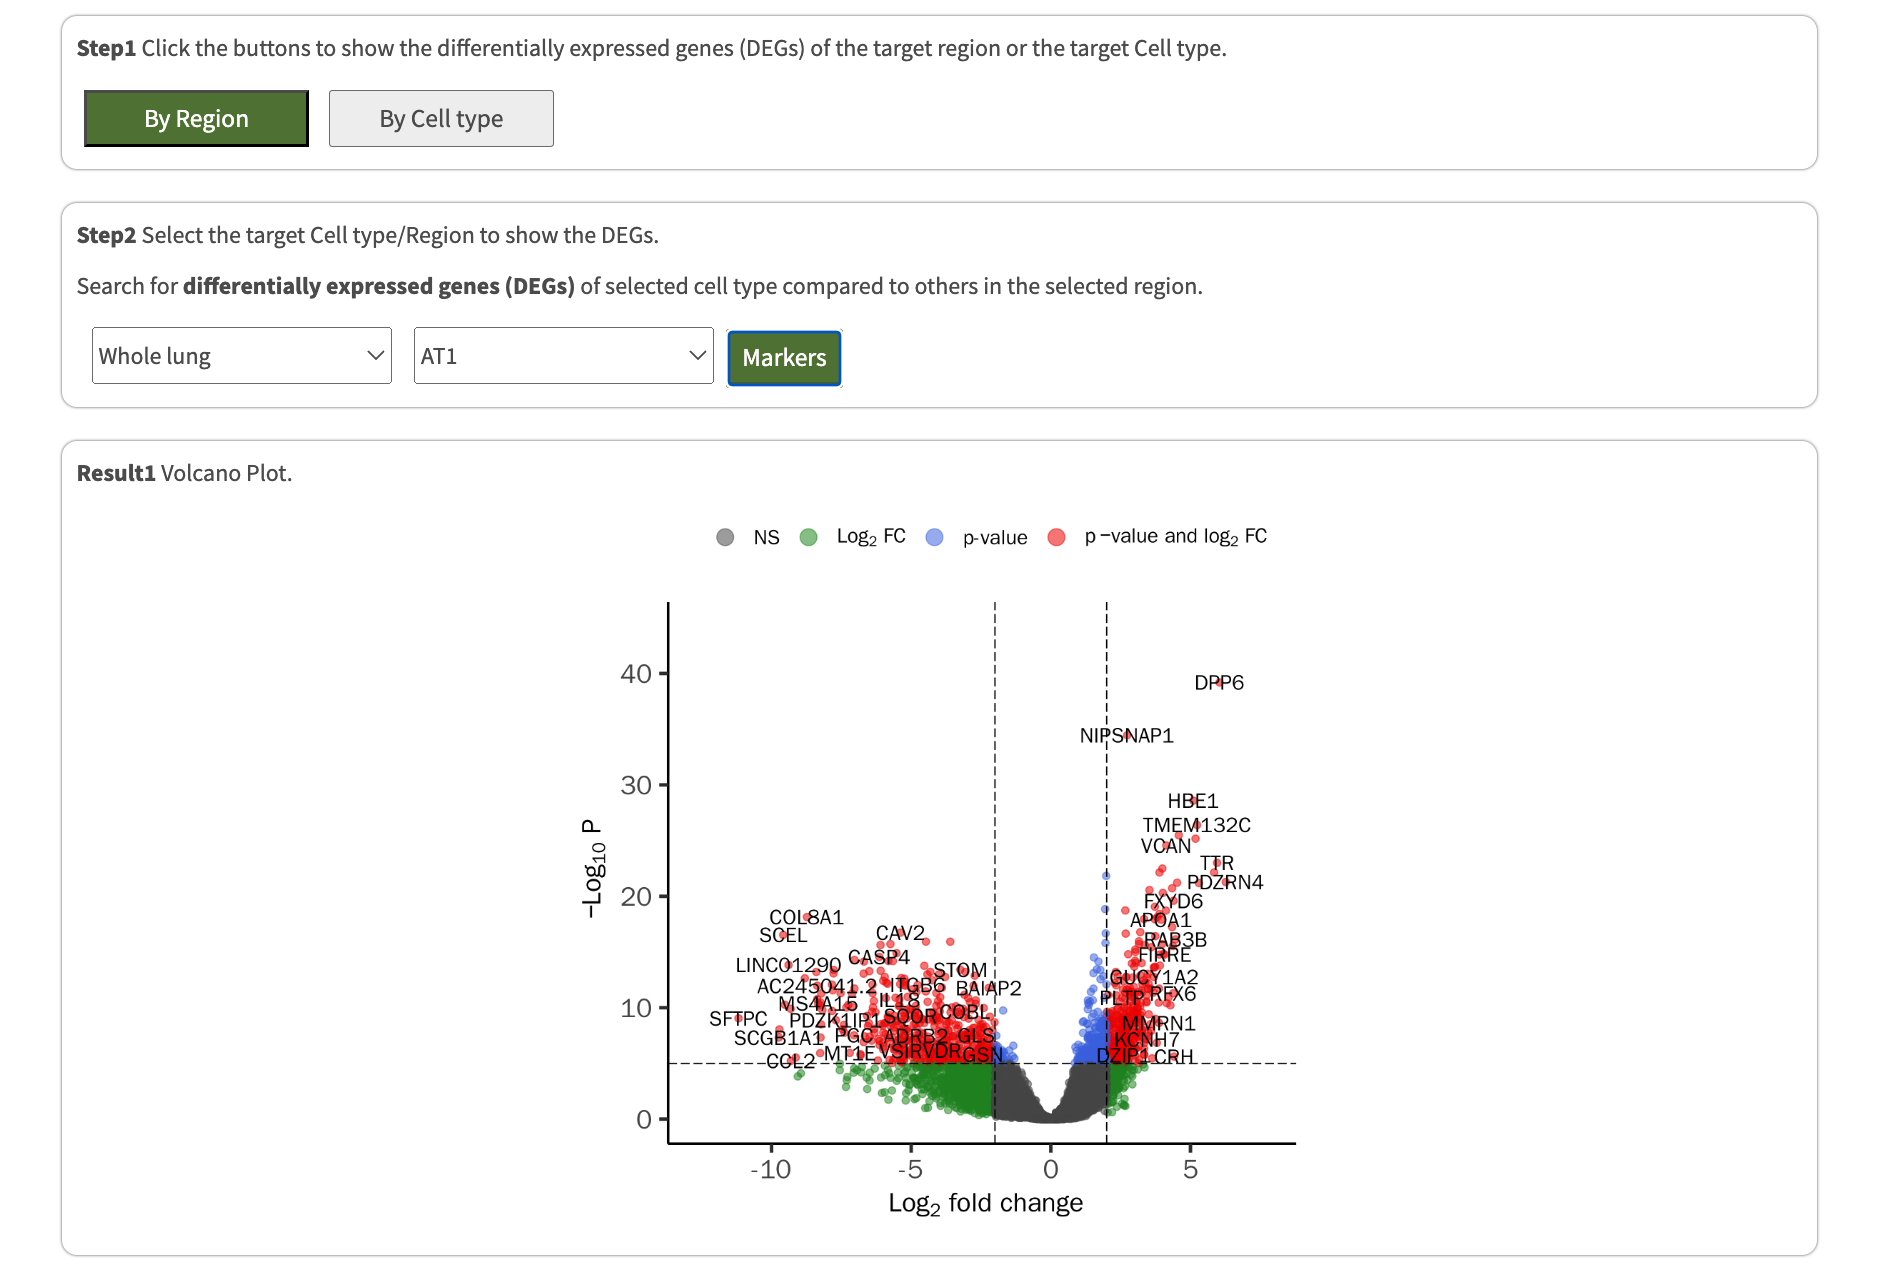
Cell type DEG (Differential expression Genes) compares the same cell type from different regions. Likewise, a violin plot of the top 3 DEGs for this cell type across different region will be shown after selection of the input.
Region DEG compares different cell types from the same region. A violin plot of the top 3 DEGs for each different cell types of the region will be shown after selection of the input.
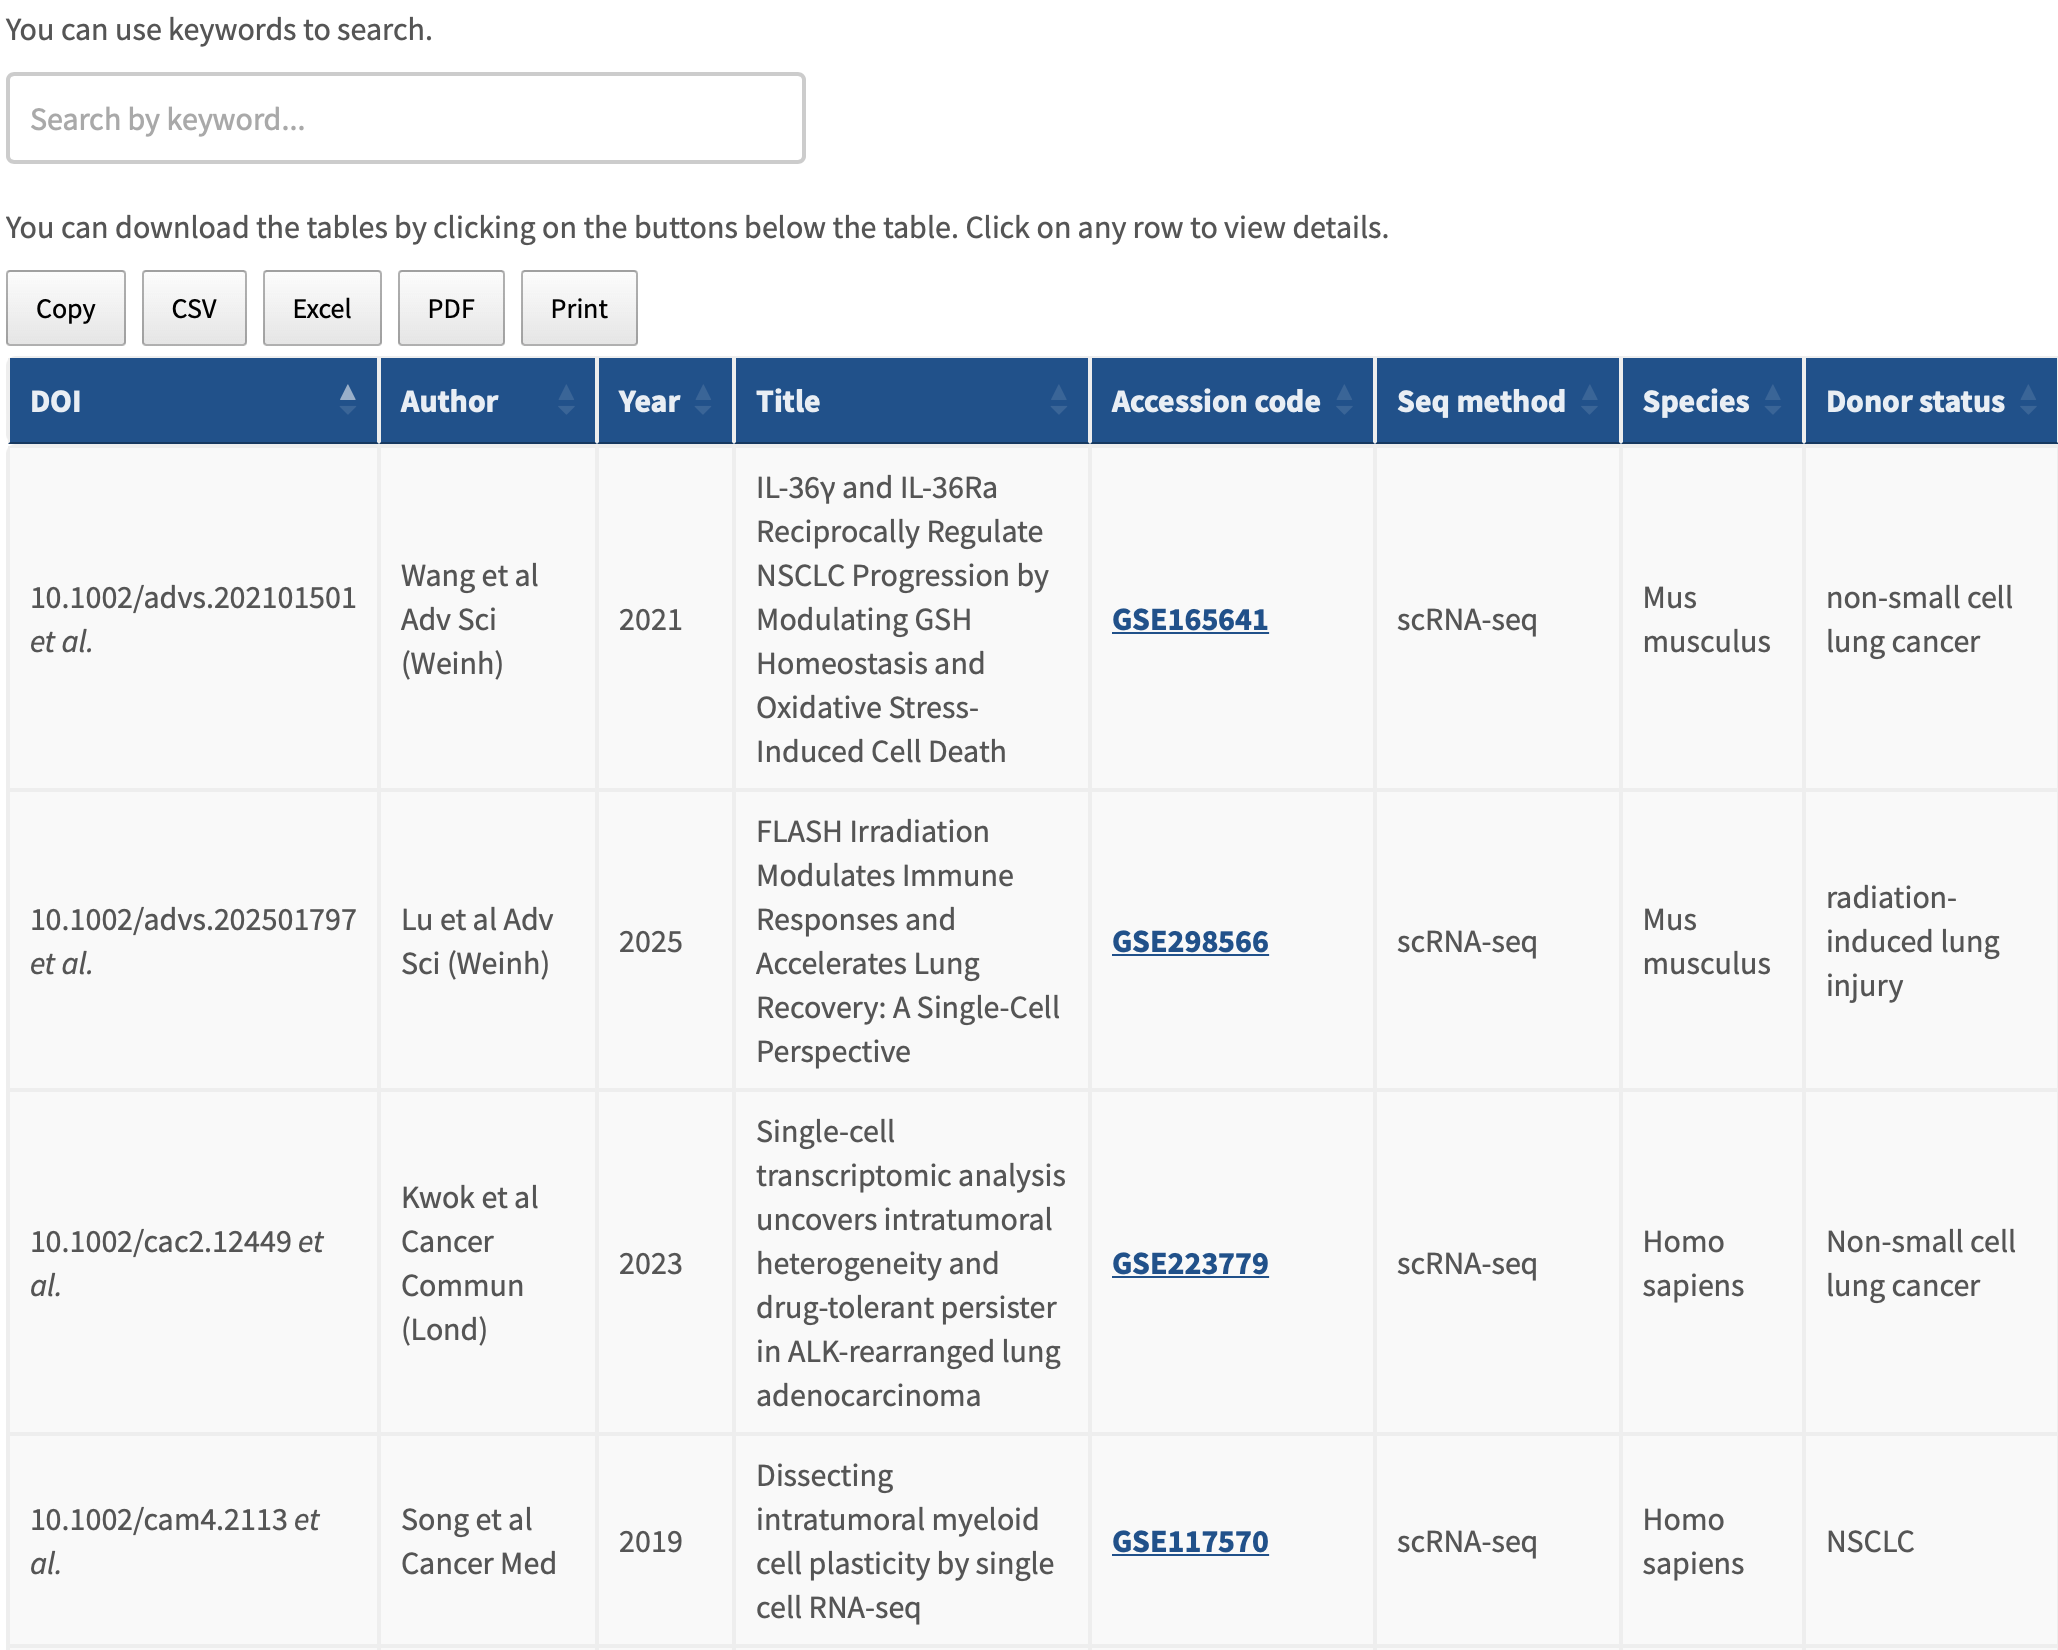
The Dataset page provides access to publicly available datasets from the human and mouse respiratory systems. A complete list of the included studies and contributing authors is available on this page. The data table can be exported using the Copy, CSV, Excel, or PDF buttons.
 Home
Home Database
 Research
 About us